By Shubham Patni, Senior Software Engineer at AlgoAnalytics
The recent years have seen a considerable rise in connected devices such as IoT [1] devices, and streaming sensor data. At present, there are billions of IoT devices connected to the internet. While you read this article, terabytes and petabytes of IoT data will be generated across the world. This data contains a huge amount of information and insights. However, processing such high volumes of streaming data is a challenge, and it requires advanced BigData capabilities to manage these challenges and derive insights from this data.
At AlgoAnalytics, we have developed a powerful tool that ingests real-time streaming data feeds (for example from IoT devices) to enable visualization and analytics for quicker business decisions.
The four steps involved underneath Streaming Big Data Analytics are as follows :
The high-level design of Streaming Big Data Analytics pipeline is illustrated in Figure 1.
Figure 1: High-Level Design
- Data Ingestion:
Data ingestion involves gathering data from various streaming sources (e.g. IoT sensors) and transporting them to a common data store. This essentially is transforming unstructured data from origin to a system where it can be stored for further processing. Data comes from various sources, in various formats, and at various speeds. It is a critical task to ingest complete data into the pipeline without any failure.
For Data Ingestion, we have used Apache Kafka [2]- a distributed messaging system that fulfills all the above requirements. We have built a highly scalable fault-tolerant multi-node Kafka cluster which can process thousands of messages per second without any data loss and downtime. Kafka Producer collects data from various sources and publishes data on different topics accordingly. Kafka Consumer consumes this data from the topics in which they are interested in. This way data from different sources is ingested in the pipeline for processing.
2. Real-Time Data Processing:
The data collected in the above step needs to be processed in real-time before pushing it to any filesystem or database. This includes transforming unstructured data to structured data. Processing includes filtering, mapping, conversion of data types, removing unwanted data, generating simplified data from complex data, etc
For this step, we have used Spark Streaming [3] which is the best combination with Apache Kafka to build real-time applications. Spark Streaming is an extension of the core Spark API that enables scalable, high-throughput, fault-tolerant stream processing of live data streams. Spark Streaming receives the data ingested through Kafka and converts it into a continuous stream of RDDs — DStreams (basic abstraction in spark streaming). Various spark transformations are applied to these DStreams to transform the data to the state from where it can be pushed to the database.
3. Data Storage:
The data received from source devices (such as IoT devices) is time-series data — measurements or events that are tracked, monitored, downsampled, and aggregated over time. Properties that make time series data very different from other data workloads are data lifecycle management, summarization, and large range scans of many records. A time-series database (TSDB) [4] is a database optimized for such time-stamped or time series data with time as a key index which is distinctly different from relational databases. A time-series database lets you store large volumes of time-stamped data in a format that allows fast insertion and fast retrieval to support complex analysis on that data.
Influxdb [5] is one such time-series database designed to handle such high write and query loads. We have set up a multi-node influxdb cluster that can handle millions of writes per second and also in-memory indexing of influxdb allows fast and efficient query results. We have also set up various continuous tasks which downsample the data to lower precision, summarized data which can be kept for a longer period of time or forever. It reduces the size of data that needs to be stored as well as the query time by multiple times as compared with very high precision data.
4. Visualization:
To add value to this processed data it is necessary to visualize our data and make some relations between them. Data visualization and analytics provide more control over data and give us the power to control this data efficiently.
We used Grafana [6], a multi-platform open-source analytics and interactive visualization web application. It provides charts, graphs, and alerts for the web when connected to supported data sources. We have created multiple dashboards for different comparisons. On these dashboards, we can visualize real-time status as well as the historical data (weeks, months or even years). We can also compare data of the same type with different parameters. Several variables are defined which provide flexibility to use dashboards for multiple visualizations. For example, we can select a single device or multiple devices or even all devices at a time. We can select how to aggregate data per minute, per hour to per year.
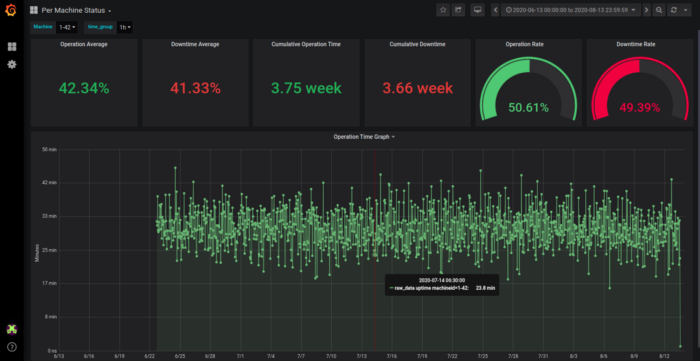
Figure 2: One of the dashboards IoT Analytics Application
Figure 2 shows the Uptime and some parameters of a selected machine for a selected period (2 months).
Applications :
As a large number of businesses in multiple sectors are moving to connected and smart devices, Streaming Big Data Analytics finds its applications across many verticals.
Few examples include real-time machine monitoring and anomaly detection in industries, sensor embedded medical devices to understand emergencies in advance, surveillance using video analytics, in Retail and Logistics to increase sale by studying customer movements, in the transport sector — smart traffic control, electronic toll collections systems, in Military for surveillance, Environmental monitoring — air quality, soil conditions, movement of wildlife, etc
For demo visit our link https://algoanalytics.com/demoapp
For further information, please contact: info@algoanalytics.com
References:
-
- IoT: https://en.wikipedia.org/wiki/Internet_of_things
- Apache Kafka: https://kafka.apache.org/documentation/#gettingStarted
- Spark Streaming: https://spark.apache.org/docs/latest/streaming-programming-guide.html
- Time Series Database: https://www.influxdata.com/time-series-database/
- InfluxDB: https://www.influxdata.com/products/influxdb-overview/
- Grafana: https://grafana.com/docs/


