By Tushar Arora
This article is the beginning of a series of 3 articles in which our final aim is to model volatility clustering of NIFTY index using GARCH model. Now that we have started this article with some fancy terms like volatility clustering, GARCH etc. Let us try to understand each term one by one.
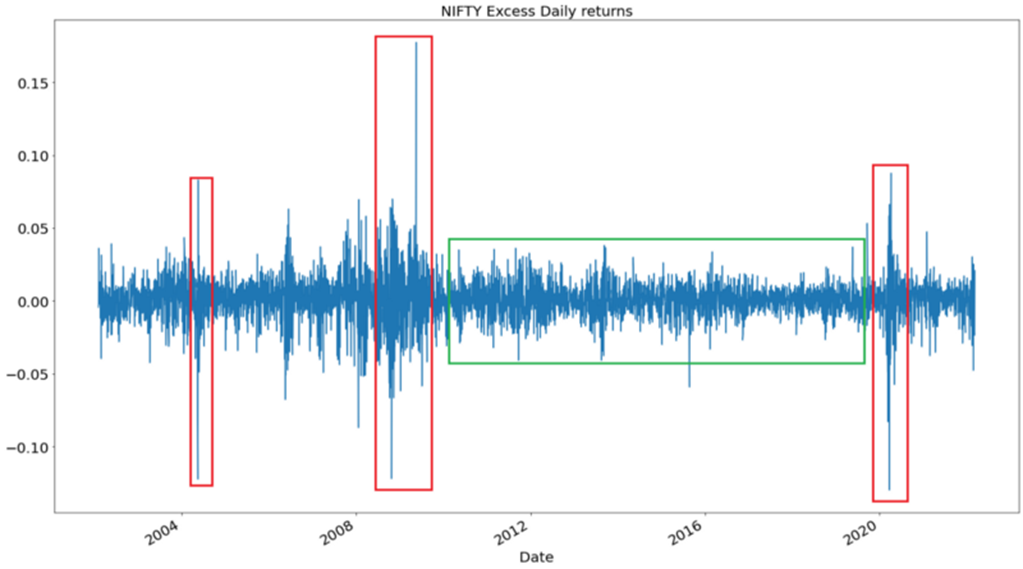
Let us look closely at this graph and try to think why some regions are encircled with red and some with green? Can you think of a reason why these regions are different just by looking at this graph? Does there exist a concept that can explain these different regions? The answers to all these questions are related to Volatility. So, let’s begin by understanding Volatility.
Volatility in most simple terms is a measure of risk. It is very much related to what we all know from statistics as variance. High volatility indicates large fluctuations in asset price during short amount of time. Therefore, high volatility implies higher risk. Let’s try to understand this term from an example completely unrelated to stock market.
Choosing Forward in Football
Suppose, there are 2 forward players: EH and KM (Does these initials sound familiar?). We want to choose a forward who can give at least 2 shots on target (more dependable or less risky) in a match. The data available to us is given below:
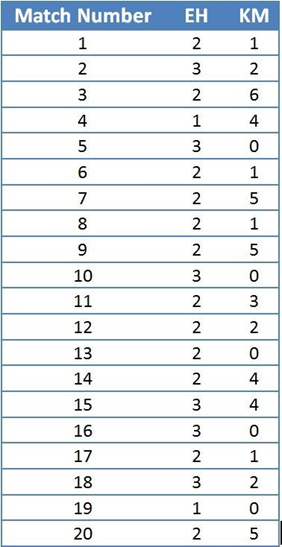
Using the above table we calculate the following results:
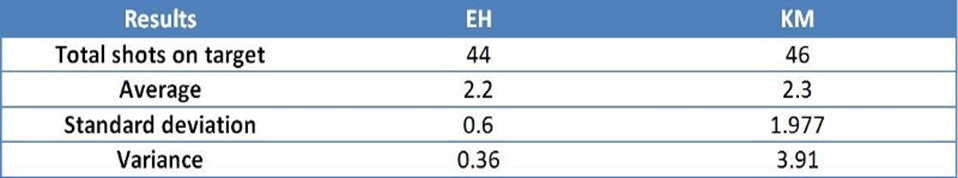
If we just look at the first 2 rows of the above table, it feels like it is better to choose KM as our forward. But the whole point of this example is Volatility. We know that standard deviation is defined as the deviation from the mean. So, it is expected (with high probability) that the number of shots on target for EH will lie in the range (2.2–0.6, 2.2 + 0.6) = (1.6,2.8). Similarly, it is expected (with high probability) that the number of shots on target for KM will lie in the range (2.3–1.977,2.3+1.977) = (0.323,4.277). The above calculated intervals shows that if we want a forward who can give at least 2 shots on target, then we should go with EH because less standard deviation (or volatility) implies lesser risk. (For football fans, are you convinced by the above arguments and believe that EH is better forward than KM? I don’t think you should because of the sole reason that the above data is made up and doesn’t contain actual data for both players. Maybe we can compare EH and KM with actual data in another blog).
Now, coming back to the questions we asked in the start of this article and keeping in mind the above example of 2 forwards in football, we can deduce that the red marked regions indicate highly volatile (or variable) region because of these large deviations from the mean zero. Similarly, the green regions indicate low volatile region because the deviations from the mean zero are pretty small when compared to red regions. So, one should try to avoid trading in highly volatile regions (Although, there are some traders who secure large amounts of profit in these times) due to the risk and unpredictability present in the market during these times.
I have used the following references to write this article:
Interested readers are encouraged to learn more about volatility from the above mentioned references.
Next, we will try to understand Volatility Clustering.